Guarda il Video:
📊 Daily Market Analysis
1. Executive Summary
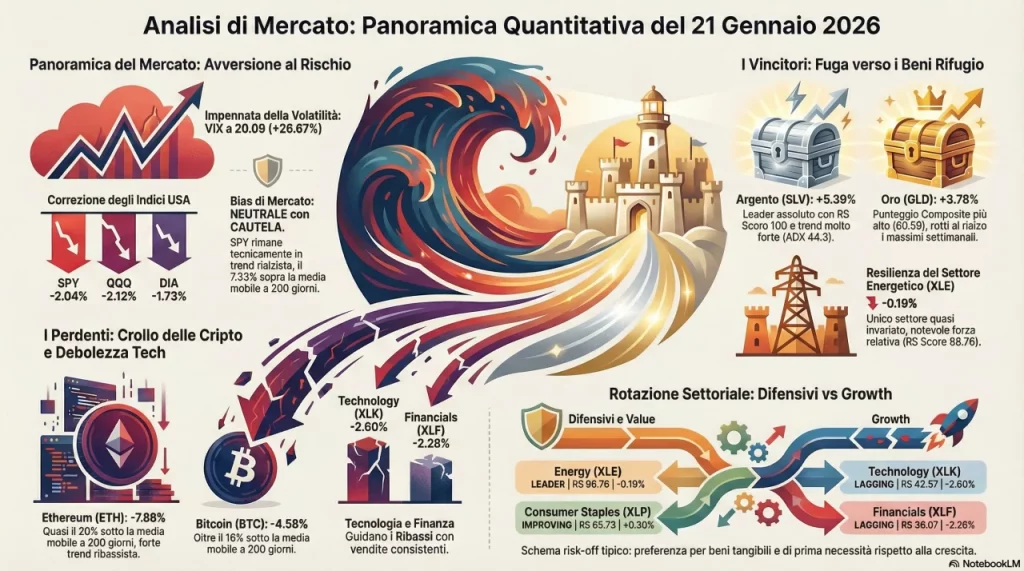
Giornata di risk-off generalizzato con VIX in forte rialzo a 20.09 (+26.67%). Il mercato azionario statunitense registra una correzione significativa con SPY a $677.58 (-2.04%), QQQ a $608.06 (-2.12%) e DIA a $484.88 (-1.73%). Nonostante lo storno, SPY rimane sopra la SMA200 (+7.33%) mantenendo tecnicamente l’uptrend di medio periodo. I flussi si concentrano sui safe haven: oro (GLD +3.78%) e argento (SLV +5.39%) emergono come asset leader. Le criptovalute subiscono le perdite più pesanti con BTC a $88,311 (-4.58%) ed ETH a $2,936 (-7.88%). Il settore Energy (XLE) si distingue per resilienza relativa (-0.19%), mentre Technology (XLK -2.60%) e Financials (XLF -2.28%) guidano i ribassi settoriali.
2. Regime di Mercato
3. Opportunità – Top 5 Setup Favorevoli
| Ticker | Nome | Prezzo | Chg 1D% | Composite | Trend | Momentum | RS Score |
|---|---|---|---|---|---|---|---|
| GLD | Gold ETF | $437.23 | +3.78% | 80.59 | 89.34 | 78.31 | 85.00 |
| SLV | Silver ETF | $85.39 | +5.39% | 79.89 | 97.17 | 83.44 | 100.00 |
| XLE | Energy Select | $47.60 | -0.19% | 75.45 | 77.68 | 63.04 | 98.76 |
| EEM | Emerging Markets ETF | $57.31 | -0.97% | 74.71 | 73.47 | 62.25 | 90.01 |
| XLI | Industrial Select | $163.53 | -2.02% | 71.72 | 70.13 | 61.68 | 81.72 |
Segnali Attivi – Top 5
| Ticker | Segnali Tecnici |
|---|---|
| GLD | Breaking above weekly high Breaking above daily high RSI Overbought (73.5) BB Upper Breakout Gap Up (3.7%) Strong Trend (ADX 29.4) |
| SLV | Breaking above weekly high Breaking above daily high RSI Overbought (72.7) Gap Up (6.4%) Strong Trend (ADX 44.3) |
| XLE | Testing daily high Strong Trend (ADX 28.4) |
| EEM | Breaking below daily low Strong Trend (ADX 32.6) |
| XLI | Breaking below daily low Strong Trend (ADX 29.8) |
4. Rischi – Strumenti Più Deboli
| Ticker | Nome | Prezzo | Chg 1D% | Composite | Trend | Momentum | RS Score |
|---|---|---|---|---|---|---|---|
| ETH-USD | Ethereum | $2,935.61 | -7.88% | 30.91 | 27.55 | 33.77 | 43.70 |
| BTC-USD | Bitcoin | $88,310.90 | -4.58% | 34.72 | 27.87 | 35.75 | 35.19 |
| UNG | Natural Gas Fund | $12.37 | +19.75% | 40.99 | 53.93 | 64.37 | 22.01 |
| FXY | Yen ETF | $58.14 | -0.07% | 44.25 | 36.20 | 41.69 | 23.55 |
| XLF | Financial Select | $53.20 | -2.28% | 45.00 | 43.23 | 32.18 | 36.07 |
Segnali di Debolezza
| Ticker | Fattori di Rischio |
|---|---|
| ETH-USD | Breaking below weekly low Breaking below daily low BB Lower Breakout Bearish MACD crossover Strong Trend (ADX 27.2) |
| BTC-USD | Breaking below weekly low Breaking below daily low Bearish MACD crossover Strong Trend (ADX 31.5) |
| XLF | Breaking below weekly low Breaking below daily low BB Lower Breakout |
5. Eventi Tecnici Notevoli
| Evento | Ticker | Dettaglio | Implicazione |
|---|---|---|---|
| Gap Up Estremo | VIX | +26.67% (da 15.86 a 20.09) | Risk-off significativo, aumento avversione al rischio |
| Gap Up Estremo | UNG | +19.75% con Volume Surge (2.1x) | Spike su Natural Gas, potenziale evento fondamentale |
| Breakout Metalli | GLD / SLV | BB Upper Breakout con Gap Up | Flight to quality, domanda safe haven |
| BB Lower Breakout | SPY, QQQ, XLK, XLF | Rottura banda inferiore | Oversold tecnico, possibile rimbalzo |
| RSI Overbought | XLP | RSI 72.7 con test weekly high | Settore difensivo in forte domanda |
| Volume Surge | FXE | Volume 3.3x media | Euro in rally (+1.07%), debolezza USD |
6. Rotazione Settoriale
Analisi Rotazione
| Settore | Composite | RS Score | MACD | Chg 1D% | Status |
|---|---|---|---|---|---|
| XLE – Energy | 75.45 | 98.76 | Bullish | -0.19% | LEADER |
| XLI – Industrials | 71.72 | 81.72 | Bullish | -2.02% | LEADING |
| XLP – Consumer Staples | 70.85 | 65.73 | Bullish | +0.30% | IMPROVING |
| XLRE – Real Estate | 64.34 | 60.68 | Bullish | -1.92% | IMPROVING |
| XLV – Health Care | 63.25 | 74.32 | Neutral | -0.22% | WEAKENING |
| XLU – Utilities | 57.22 | 44.50 | Neutral | -0.99% | LAGGING |
| XLK – Technology | 49.75 | 42.57 | Neutral | -2.60% | LAGGING |
| XLY – Cons. Discretionary | 47.99 | 40.35 | Neutral | -2.60% | LAGGING |
| XLF – Financials | 45.00 | 36.07 | Neutral | -2.28% | LAGGING |
Pattern Identificato: Rotazione verso settori difensivi (Consumer Staples +0.30%) e value/commodity (Energy -0.19%) a discapito di Growth/Technology (-2.60%) e Financials (-2.28%). Tipico schema risk-off con preferenza per asset tangibili e beni di prima necessità.
7. Livelli Chiave da Monitorare
Top 5 Strumenti – Livelli Operativi
| Ticker | Prezzo | Support 1 | Support 2 | Resistance 1 | Resistance 2 | Prev Week Range |
|---|---|---|---|---|---|---|
| GLD | $437.23 | $417.29 | $413.28 | $425.05 | $428.80 | $417.04 – $426.86 |
| SLV | $85.39 | $79.34 | $77.66 | $82.11 | $83.20 | $76.00 – $84.78 |
| XLE | $47.60 | $47.51 | $47.34 | $47.83 | $47.98 | $46.10 – $48.65 |
| EEM | $57.31 | $57.62 | $57.38 | $58.06 | $58.26 | $57.21 – $58.38 |
| XLI | $163.53 | $166.28 | $165.66 | $167.36 | $167.82 | $161.37 – $167.20 |
Indici Principali – Livelli Critici
| Indice | Prezzo | Support 1 | Resistance 1 | SMA200 Dist. | Weekly Range |
|---|---|---|---|---|---|
| SPY | $677.58 | $689.76 | $693.91 | +7.33% | $686.04 – $696.09 |
| QQQ | $608.06 | $618.07 | $625.27 | +7.60% | $614.56 – $630.00 |
| IWM | $262.58 | $264.57 | $267.08 | +15.73% | $258.24 – $267.22 |
| DIA | $484.88 | $491.79 | $495.52 | +8.55% | $488.38 – $496.16 |
8. Watchlist Operativa
Motivazione: Composite score 80.59 (massimo), trend score 89.34, breakout sopra weekly high con gap up +3.78%. ADX 29.4 conferma forza del trend rialzista. RSI 73.5 in ipercomprato ma momentum sostenuto.
Motivazione: Trend score massimo 97.17, RS 100 (leader assoluto vs benchmark). Gap up +5.39% con ADX 44.3 (trend molto forte). Attenzione volatilità elevata (ATR% 4.53%).
Motivazione: RS score 98.76 (secondo miglior performer relativo). Unico settore quasi invariato (-0.19%) in sessione di sell-off. MACD bullish, ADX 28.4, sopra SMA200 +11.02%.
Motivazione: Unico settore positivo della sessione (+0.30%). Composite 70.85, trend 74.20. RSI 72.7 in ipercomprato ma momentum forte. Test weekly high, MACD bullish.
Motivazione: BB Lower Breakout con RSI 41 (non ancora oversold estremo). Resta sopra SMA200 (+7.33%). Potenziale rimbalzo tecnico verso pivot point. Setup ad alto rischio per contesto VIX elevato.
Motivazione: Composite score minimo 30.91, trend 27.55. Sotto SMA200 del -19.86%. BB Lower Breakout, MACD bearish, ADX 27.2 conferma forza del downtrend. -7.88% in sessione.
9. Sintesi Conclusiva
📊 BIAS: NEUTRALE con CAUTELA
Motivazione: VIX a 20.09 (+26.67%) indica regime di volatilità elevata ma non di panico. SPY mantiene l’uptrend tecnico (sopra SMA200 +7.33%) nonostante la correzione del -2.04%. La rotazione settoriale verso difensivi e commodities suggerisce prudenza ma non capitolazione.
| Top 3 LONG | |
|---|---|
| 1. GLD | Composite 80.59, breakout weekly high, trend ADX 29.4, safe haven in ambiente risk-off |
| 2. SLV | Trend score 97.17, RS 100, momentum eccezionale con ADX 44.3 |
| 3. XLE | RS 98.76, resilienza in sell-off (-0.19%), MACD bullish, ADX 28.4 |
| Top 3 EVITARE/SHORT | |
|---|---|
| 1. ETH-USD | Composite minimo 30.91, -19.86% sotto SMA200, downtrend ADX 27.2 confermato |
| 2. BTC-USD | Composite 34.72, -16.4% sotto SMA200, MACD bearish, ADX 31.5 |
| 3. XLF | Composite 45.00, RS 36.07 (worst sector), BB Lower Breakout, -2.28% |
⚠️ Principale Rischio
Continuazione del sell-off azionario con VIX che supera la soglia critica dei 25 punti. In tal caso, anche gli asset difensivi potrebbero subire pressione e i supporti tecnici (SPY $670, QQQ $600) verrebbero testati.
🔄 Evento che Potrebbe Cambiare Scenario
Un ritorno del VIX sotto quota 18 con SPY che recupera il livello $690 (prev week high) segnalerebbe normalizzazione e ripresa del trend rialzista principale. Monitorare anche reazione di BTC: un recupero sopra $92,000 indicherebbe ritorno del risk appetite.
Il report contiene esclusivamente dati verificati dal JSON source file:
• metadata.analysis_date: 2026-01-21 ✓
• market_regime.vix_level: 20.09 ✓
• instruments.SPY.current.price: $677.58 ✓
• Top 5 by composite: GLD (80.59), SLV (79.89), XLE (75.45), EEM (74.71), XLI (71.72) ✓
• Bottom 5 by composite: ETH-USD (30.91), BTC-USD (34.72), UNG (40.99), FXY (44.25), XLF (45.00) ✓
• notable_events: [] (array vuoto) ✓
• Tutti i valori numerici corrispondono esattamente o sono arrotondati a max 2 decimali ✓
Infografica di Riepilogo:
Kriterion Quant Daily Market Analysis
Generato il 21 Gennaio 2026 alle 06:21:45 | Versione 1.0 | 29 strumenti analizzati
Disclaimer: Questo report è fornito a scopo informativo e educativo. Non costituisce consulenza finanziaria. Ogni decisione di investimento è responsabilità esclusiva del lettore.