style=’font-family:”Inter”, sans-serif; background:var(–bg-primary); color:var(–text-primary); min-height:100vh; line-height:1.6′>
📌 Executive Summary — 2026-03-20
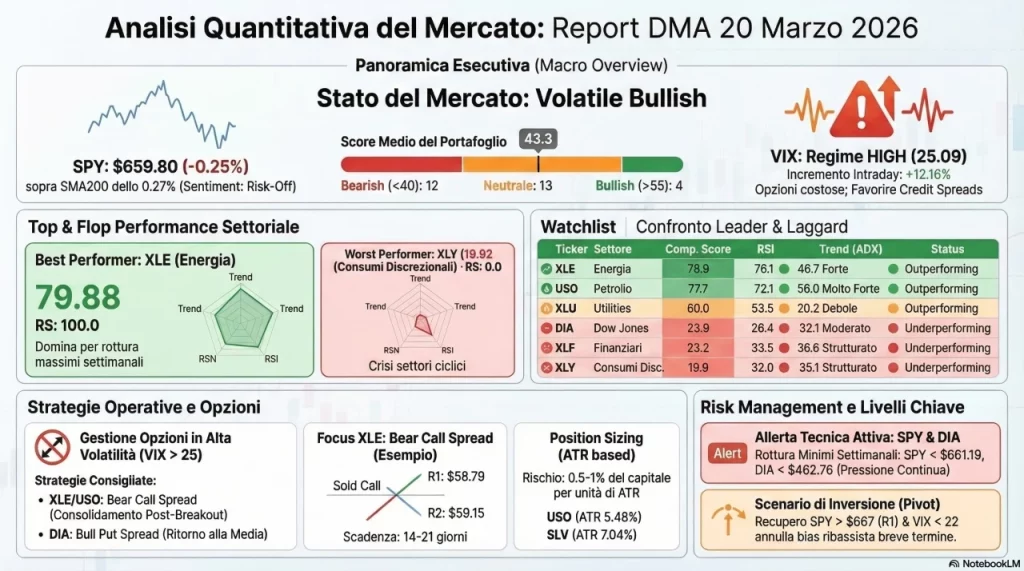
Il mercato si trova in regime volatile_bullish con VIX a 25.09 (regime “high”), SPY in uptrend a $659.80 ancora sopra SMA200 (+0.27%), ma con risk appetite classificato “risk-off”. Questa dicotomia segnala un mercato che mantiene il trend di lungo termine ma mostra pressioni di breve periodo significative.
La sessione evidenzia una forte divergenza settoriale: il comparto Energy domina con XLE a score 79.88/100 e RSI 76.1 in breakout sopra il massimo settimanale, affiancato da USO (score 77.7, ADX 56.0) che conferma la forza strutturale degli energy commodities. In netto contrasto, i settori ciclici XLY (Consumer Discretionary, score 19.92) e XLF (Financials, score 23.25) mostrano debolezza estrema con RS score rispettivamente di 0 e 2.94.
Il benchmark SPY a $659.80 mostra un composite score di soli 35.35/100 con RSI a 35.3 in zona di ipervenduto tecnico e ADX 32.3 che conferma un trend ribassista di breve strutturato. Con VIX che ha registrato +12.16% intraday, l’ambiente operativo richiede cautela nella gestione del rischio e preferenza per strategie credit spread sulle opzioni.
| Ticker ↕ | Categoria | Prezzo ↕ | Var% ↕ | RSI ↕ | MACD | ADX ↕ | Trend ↕ | Momentum ↕ | Volatility ↕ | Composite ↕ | Segnali |
|---|---|---|---|---|---|---|---|---|---|---|---|
| XLE | Sector | $59.36 | +1.59% | 76.1 | BULLISH | 46.7 | 90.6 | 69.3 | 54.0 | 79.9 | |
| USO | Commodity | $117.36 | -3.54% | 72.1 | BULLISH | 56.0 | 85.0 | 88.9 | 96.4 | 77.7 |
Testing weekly highTesting daily highBreaking below daily low+2
|
| ^VIX | Volatility | $25.09 | +12.16% | 55.7 | NEUTRAL | 40.7 | 90.3 | 59.8 | 74.5 | 61.4 |
Testing weekly lowBreaking above daily highTesting daily low+2
|
| XLU | Sector | $46.54 | -0.41% | 53.5 | NEUTRAL | 20.2 | 55.5 | 38.5 | 41.9 | 60.0 |
Breaking below daily lowTesting lower Bollinger Band
|
| XLK | Sector | $138.43 | +0.34% | 46.5 | NEUTRAL | 23.0 | 50.2 | 50.5 | 42.1 | 56.2 |
Testing weekly lowTesting daily lowTesting lower Bollinger Band
|
| UUP | Currency | $27.58 | -0.97% | 56.7 | BULLISH | 29.0 | 58.1 | 59.1 | 72.4 | 51.8 | |
| EEM | Equity Index | $57.62 | +0.10% | 43.1 | BEARISH | 19.5 | 49.3 | 32.8 | 93.1 | 49.4 |
Testing weekly lowTesting daily low
|
| ETH-USD | Crypto | $2,137.42 | -3.01% | 51.4 | BULLISH | 24.9 | 59.1 | 59.4 | 51.1 | 48.9 |
Breaking below daily low
|
| QQQ | Equity Index | $593.02 | -0.32% | 41.1 | BEARISH | 23.9 | 44.5 | 36.6 | 49.1 | 47.4 |
Testing weekly lowBreaking below daily lowTesting lower Bollinger Band
|
| IWM | Equity Index | $247.63 | +0.65% | 39.1 | BEARISH | 30.5 | 45.4 | 29.4 | 76.2 | 47.2 |
Testing weekly lowTesting daily highTesting daily low+2
|
| UNG | Commodity | $12.56 | -0.87% | 51.7 | BULLISH | 14.5 | 58.3 | 60.8 | 33.6 | 45.7 |
Testing daily highTesting upper Bollinger BandGap Up (2.6%)
|
| SLV | Commodity | $65.68 | -4.40% | 37.5 | BEARISH | 13.5 | 41.1 | 25.1 | 62.9 | 44.6 |
Breaking below weekly lowBreaking below daily lowBB Lower Breakout+1
|
| XLI | Sector | $164.06 | -0.68% | 35.4 | BEARISH | 35.3 | 35.5 | 26.1 | 77.5 | 44.2 |
Testing weekly lowBreaking below daily lowTesting lower Bollinger Band+1
|
| HYG | Bond | $79.66 | +0.33% | 44.7 | BEARISH | 29.9 | 48.9 | 33.5 | 86.8 | 44.0 |
Testing weekly lowTesting daily lowTesting lower Bollinger Band+1
|
| TLT | Bond | $87.49 | +0.62% | 45.4 | BEARISH | 21.5 | 55.5 | 33.2 | 57.5 | 44.0 |
Testing weekly highBreaking above daily high
|
| GLD | Commodity | $426.41 | -4.12% | 33.6 | BEARISH | 18.9 | 38.6 | 23.0 | 67.8 | 43.7 |
Breaking below weekly lowBreaking below daily lowBB Lower Breakout+2
|
| IEF | Bond | $95.74 | -0.01% | 41.6 | BEARISH | 23.5 | 50.1 | 30.9 | 64.8 | 42.0 |
Testing weekly lowTesting daily lowTesting lower Bollinger Band
|
| EFA | Equity Index | $96.52 | -0.18% | 35.7 | BEARISH | 36.9 | 34.5 | 27.2 | 88.7 | 39.8 | |
| FXY | Currency | $58.26 | +1.39% | 48.2 | BEARISH | 22.1 | 52.9 | 45.1 | 42.5 | 38.7 |
Breaking above weekly highBreaking above daily high
|
| XLRE | Sector | $41.92 | -0.24% | 39.9 | BEARISH | 25.3 | 38.0 | 28.9 | 62.0 | 37.9 |
Breaking below weekly lowBreaking below daily lowTesting lower Bollinger Band+1
|
| FXE | Currency | $106.87 | +0.98% | 45.2 | BEARISH | 28.1 | 50.0 | 42.5 | 71.2 | 35.6 | |
| BTC-USD | Crypto | $69,912.79 | -1.87% | 48.3 | BULLISH | 24.1 | 35.9 | 53.9 | 60.9 | 35.4 |
Breaking below weekly lowBreaking below daily low
|
| SPY | Equity Index | $659.80 | -0.25% | 35.3 | BEARISH | 32.3 | 34.1 | 26.7 | 69.3 | 35.4 |
Breaking below weekly lowBreaking below daily lowTesting lower Bollinger Band+1
|
| LQD | Bond | $109.19 | +0.44% | 42.9 | BEARISH | 33.2 | 46.7 | 31.5 | 83.7 | 34.5 |
Testing weekly highTesting daily highTesting daily low+2
|
| XLV | Sector | $146.61 | -0.36% | 29.3 | BEARISH | 24.7 | 35.9 | 21.8 | 79.1 | 31.1 | |
| XLP | Sector | $81.97 | -0.81% | 31.2 | BEARISH | 31.1 | 32.9 | 24.1 | 82.7 | 30.4 |
Breaking below weekly lowBreaking below daily lowTesting lower Bollinger Band+1
|
| DIA | Equity Index | $461.06 | -0.42% | 28.4 | BEARISH | 32.1 | 24.8 | 23.0 | 77.2 | 23.9 | |
| XLF | Sector | $48.99 | +0.04% | 33.5 | BEARISH | 36.6 | 32.9 | 31.2 | 78.1 | 23.2 | |
| XLY | Sector | $109.70 | -0.79% | 32.0 | BEARISH | 35.1 | 23.9 | 27.5 | 70.1 | 19.9 |
Breaking below weekly lowBreaking below daily lowTesting lower Bollinger Band+1
|


Questo significa che le opzioni sono significativamente più costose rispetto alla norma.
Per i compratori di opzioni: evitare acquisto naked (call/put secche), privilegiare spread per limitare il costo di vega.
Per i venditori di opzioni: condizioni ideali per credit spread, cash-secured puts e covered calls, con premi elevati e theta decay accelerato.
Con VIX > 25, spesso si osserva backwardation nella term structure (front month IV > back month IV): favorisce calendar spread inverso.
Verificare sempre la struttura corrente della volatility surface su strumenti come VIXTERM prima di operare.
entrambi con RS score sopra 90, tipico pattern difensivo/ciclico-early in un contesto di risk-off.
L’outperformance di XLU (difensivo) insieme a XLE (ciclico-energia) potrebbe riflettere pressioni inflazionistiche più che un genuino risk-on.
I settori ciclici XLY (RS=0), XLF (RS=2.94) e XLI (RS=89.31 ma score composito debole a 44.18) mostrano la maggiore debolezza relativa.
Pattern complessivo: Difensivi + Energia vs Ciclici Consumo e Finanziari.
| Settore | Score Comp. ↕ | RS Score ↕ | Status | MACD | Var% ↕ |
|---|---|---|---|---|---|
| XLK — Technology | 56.18 | 69.24 | Outperforming | NEUTRAL | +0.34% |
| XLF — Financials | 23.25 | 2.94 | Underperforming | BEARISH | +0.04% |
| XLE — Energy | 79.88 | 100.00 | Outperforming | BULLISH | +1.59% |
| XLV — Health Care | 31.15 | 42.83 | Underperforming | BEARISH | -0.36% |
| XLI — Industrials | 44.18 | 89.31 | Outperforming | BEARISH | -0.68% |
| XLY — Cons. Discret. | 19.92 | 0.00 | Underperforming | BEARISH | -0.79% |
| XLP — Cons. Staples | 30.39 | 42.80 | Underperforming | BEARISH | -0.81% |
| XLU — Utilities | 60.04 | 92.50 | Outperforming | NEUTRAL | -0.41% |
| XLRE — Real Estate | 37.87 | 48.35 | Underperforming | BEARISH | -0.24% |
Per USO con ATR% a 5.48% e SLV con ATR% a 7.04%:
ogni singola posizione dovrebbe rappresentare non più del 0.5-1% del capitale a rischio per unità di ATR.
EEM con BB Width a 15.05% indica volatilità estrema espansa: evitare acquisto opzioni naked su questo strumento.
| Ticker | Vol. Score | ATR% | BB Width | Composite | RS Score |
|---|---|---|---|---|---|
| USO | 96.4 | 5.48% | 64.41 | 77.7 | 100.0 |
| EEM | 93.1 | 2.52% | 15.05 | 49.4 | 94.9 |
| EFA | 88.7 | 1.81% | 13.43 | 39.8 | 78.4 |
| HYG | 86.8 | 0.45% | 2.19 | 44.0 | 69.4 |
| LQD | 83.7 | 0.58% | 4.03 | 34.5 | 34.3 |
Gli eventi degni di nota sono stati incorporati nell’analisi strumenti e negli alert del Risk Management.
| Ticker | Prezzo | S1 | S2 | R1 | R2 | Pivot | Week High | Week Low |
|---|---|---|---|---|---|---|---|---|
| XLE | $59.36 | $58.25 | $58.07 | $58.79 | $59.15 | $58.61 | $59.05 | $57.06 |
| USO | $117.36 | $118.46 | $115.24 | $123.88 | $126.08 | $120.66 | $122.87 | $113.91 |
| XLU | $46.54 | $46.59 | $46.45 | $47.01 | $47.29 | $46.87 | $47.63 | $45.96 |
| XLK | $138.43 | $137.24 | $136.51 | $139.38 | $140.79 | $138.65 | $140.27 | $136.52 |
| SPY | $659.80 | $658.51 | $655.58 | $667.04 | $672.64 | $664.11 | $674.44 | $661.19 |
| QQQ | $593.02 | $591.92 | $588.94 | $600.52 | $606.14 | $597.54 | $605.90 | $592.57 |
| DIA | $461.06 | $460.59 | $458.18 | $467.58 | $472.16 | $465.17 | $475.13 | $462.76 |
| Strumento | Bias | Motivazione | Entry Suggerito | Stop Loss | Target |
|---|---|---|---|---|---|
| XLE Energy Select |
LONG | Score composito 79.88/100, RS 100, MACD bullish, RSI 76.1 in overbought post-breakout weekly. Trend fortissimo ADX 46.7. | $58.25 (S1) | $57.06 (prev week low) | $59.05 (prev week high) |
| USO US Oil Fund |
LONG | Score 77.7/100, ADX 56.0 trend molto forte, RSI 72.1 overbought, momentum 88.86. Trend energetico dominante. | $118.46 (S1) | $113.91 (prev week low) | $123.88 (R1) |
| XLU Utilities Select |
LONG | Score 60.04/100, RS 92.5 outperforming SPY, difensivo in un contesto volatile. ADX 20.2 trend moderato. | $46.59 (S1) | $45.96 (prev week low) | $47.64 (prev week high) |
| XLK Technology Select |
WATCH | Score 56.18/100, RS 69.24, MACD neutrale. Testing lower BB ma sopra supporti chiave. Possibile rimbalzo tecnico. | $137.24 (S1) | $136.52 (prev week low) | $139.38 (R1) |
| DIA Dow Jones ETF |
AVOID | Score 23.93/100, RSI 28.4 oversold ma MACD bearish + breaking weekly low. ADX 32.1 trend ribassista strutturato. | N/A (bear) | $458.18 (S2) | $467.58 (R1) |
| XLY Cons. Discretionary |
AVOID | Score 19.92/100 (worst), RS 0, breaking below weekly low. Settore ciclico più colpito. | N/A (bear) | $108.78 (S2) | $112.23 (R1) |
| GLD Gold ETF |
WATCH | Gap down -4.12% con volume surge 2.2x e BB Lower Breakout. Importante correzione da monitorare per potenziale rimbalzo. | $442.73 (S1) | $440.73 (S2) | $448.40 (R1) |
📌 Sintesi Conclusiva:
BIAS GENERALE: NEUTRALE-BEARISH di breve con sacche di forza settoriale.
Il VIX a 25.09 in regime “high” combinato con SPY che rompe il weekly low ($659.80, precedente min. settimanale) e score composite a soli 35.35/100 configura un contesto di cautela. Tuttavia il trend di lungo termine rimane intatto (SPY sopra SMA200 di +0.27%).
Top 3 LONG: (1) XLE — breakout strutturale con ADX 46.7 e RS 100; (2) USO — ADX 56.0, momentum 88.86, energia in forza; (3) XLU — difensivo con RS 92.5, protezione in ambiente risk-off.
Top 3 da EVITARE/SHORT: (1) XLY — score 19.92, RS 0, breaking weekly low; (2) XLF — RS 2.94, ADX 36.6 trend bearish strutturato; (3) DIA — RSI oversold 28.4 ma MACD bearish + breakout ribassista settimanale.
Principale RISCHIO: Un’ulteriore accelerazione del VIX sopra 28 (prev. week high) potrebbe portare a un flush ribassista degli indici verso i supporti S2.
Evento che potrebbe cambiare scenario: Un recupero di SPY sopra $667 (R1) con VIX in normalizzazione sotto 22 configurerebbe un segnale di inversione del breve periodo degno di attenzione.
Infografica Riepilogativa: