Kriterion Quant — Daily Market Analysis
Executive Summary
VIX Level
SPY Price
Avg Composite Score
Best Instrument
Worst Instrument
Signal Balance
Narrative Analisi di Mercato
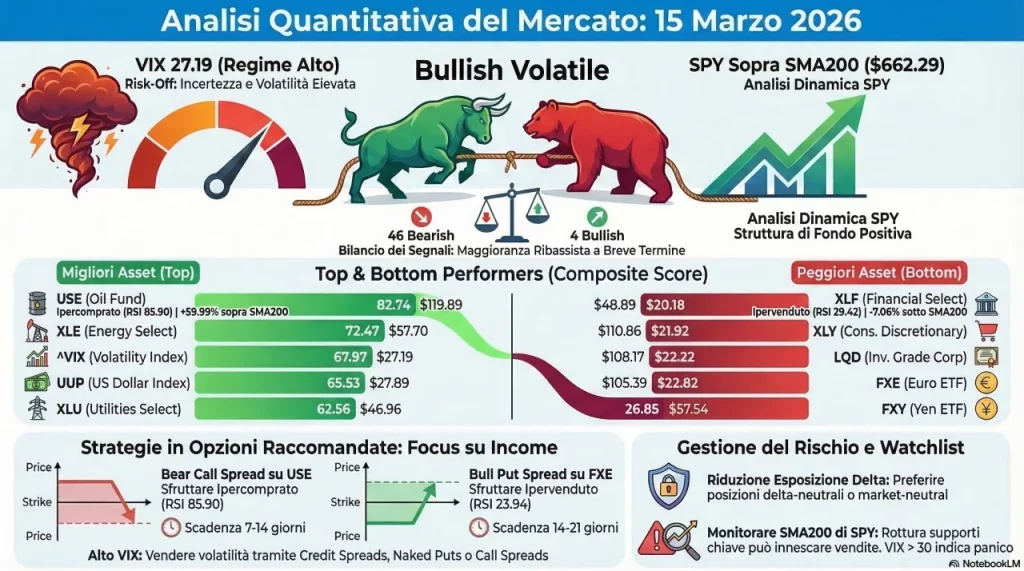
Il mercato registra un regime di elevata volatilità con VIX a 27.19,
indicativo di condizioni di risk-off e incertezza. SPY mantiene un trend uptrend
al di sopra della media mobile 200,
suggerendo dinamica rialzista costruttiva.
Con un punteggio composito medio di 44.05, il portafoglio analizzato mostra
mixed sentiment. I segnali bullish (4) superano i bearish (46),
ma la volatilità elevata richiede gestione del rischio attenta.
Consigliato approccio difensivo con preferenza per strategie di income e risk control.
Scoreboard Strumenti
| Ticker | Name | Category | Price | Change % | RSI | MACD | ADX | Trend | Momentum | Volatility | Composite | Signals |
|---|---|---|---|---|---|---|---|---|---|---|---|---|
| USO | Oil Fund | Commodity | $119.89 | +1.27% | 85.90 | BULLISH | 49.75 | 94.87 | 94.93 | 94.66 | 82.74 | Breaking above daily high, RSI Extremely… |
| XLE | Energy Select | Sector | $57.70 | +0.33% | 70.23 | NEUTRAL | 44.94 | 81.28 | 53.86 | 53.84 | 72.47 | RSI Overbought (70.2), Testing upper Bol… |
| ^VIX | CBOE Volatility Index | Volatility | $27.19 | -0.37% | 61.74 | BULLISH | 41.31 | 87.66 | 82.86 | 71.25 | 67.97 | Testing daily high, Gap Up (2.1%) |
| UUP | US Dollar Index ETF | Currency | $27.89 | +0.76% | 78.10 | BULLISH | 26.45 | 78.22 | 77.90 | 58.67 | 65.53 | Breaking above weekly high, Breaking abo… |
| XLU | Utilities Select | Sector | $46.96 | +0.99% | 60.48 | NEUTRAL | 23.40 | 68.56 | 40.75 | 59.91 | 62.56 | Testing weekly high, Testing daily high |
| GLD | Gold ETF | Commodity | $460.84 | -1.29% | 47.72 | NEUTRAL | 16.10 | 53.26 | 34.53 | 58.63 | 56.28 | Breaking below weekly low, Breaking belo… |
| SLV | Silver ETF | Commodity | $72.69 | -4.96% | 44.91 | BEARISH | 11.26 | 51.45 | 35.01 | 63.34 | 50.50 | Breaking below weekly low, Breaking belo… |
| QQQ | Nasdaq 100 ETF | Equity Index | $593.72 | -0.59% | 39.85 | BEARISH | 19.48 | 47.04 | 38.01 | 44.62 | 47.47 | Breaking below daily low, BB Lower Break… |
| ETH-USD | Ethereum | Crypto | $2092.56 | +0.94% | 52.42 | NEUTRAL | 23.14 | 54.83 | 58.73 | 41.03 | 47.38 | Testing weekly high, Testing daily high |
| XLK | Technology Select | Sector | $136.80 | -0.75% | 41.99 | BEARISH | 20.69 | 38.57 | 44.75 | 42.83 | 46.14 | Breaking below daily low, Testing lower … |
| BTC-USD | Bitcoin | Crypto | $70968.27 | +0.67% | 53.39 | NEUTRAL | 26.29 | 58.37 | 62.12 | 63.73 | 45.61 | Testing weekly high, Breaking above dail… |
| IWM | Russell 2000 ETF | Equity Index | $246.59 | -0.33% | 33.61 | BEARISH | 24.79 | 46.99 | 23.52 | 72.60 | 45.31 | Testing daily high, Testing daily low |
| XLRE | Real Estate Select | Sector | $42.25 | +0.26% | 42.37 | NEUTRAL | 27.24 | 57.47 | 29.50 | 59.72 | 44.91 | Testing daily high, Testing lower Bollin… |
| UNG | Natural Gas Fund | Commodity | $12.64 | -3.07% | 52.41 | BULLISH | 14.22 | 48.17 | 67.03 | 34.86 | 44.33 | Breaking below daily low, Gap Down (-2.1… |
| HYG | High Yield Corporate | Bond | $79.20 | -0.19% | 31.08 | BEARISH | 24.43 | 39.36 | 25.80 | 83.26 | 44.17 | Breaking below weekly low, Breaking belo… |
| EEM | Emerging Markets ETF | Equity Index | $56.80 | -0.26% | 37.15 | BEARISH | 23.17 | 41.75 | 24.71 | 92.05 | 42.70 | Breaking below daily low |
| XLI | Industrial Select | Sector | $164.65 | -0.36% | 34.57 | BEARISH | 34.80 | 32.17 | 24.18 | 76.62 | 42.57 | Breaking below weekly low, Breaking belo… |
| IEF | 7-10 Year Treasury | Bond | $95.59 | -0.10% | 37.01 | BEARISH | 22.07 | 50.84 | 26.95 | 58.93 | 42.00 | Testing weekly low, Testing daily low |
| XLP | Consumer Staples | Sector | $84.74 | +0.58% | 41.99 | BEARISH | 33.53 | 52.10 | 27.74 | 78.99 | 41.28 | Testing daily high, Strong Trend (ADX 33… |
| XLV | Health Care Select | Sector | $149.79 | -0.25% | 33.22 | BEARISH | 17.78 | 41.12 | 23.58 | 72.14 | 38.47 | Breaking below weekly low, Breaking belo… |
| SPY | S&P 500 ETF | Equity Index | $662.29 | -0.57% | 33.54 | BEARISH | 26.01 | 37.75 | 26.12 | 60.71 | 37.56 | Breaking below weekly low, Testing daily… |
| EFA | EAFE Markets ETF | Equity Index | $96.30 | -1.19% | 30.85 | BEARISH | 34.79 | 35.39 | 21.85 | 86.00 | 36.56 | Breaking below daily low, Testing lower … |
| DIA | Dow Jones ETF | Equity Index | $466.41 | -0.23% | 28.49 | BEARISH | 26.39 | 35.81 | 21.82 | 73.11 | 31.37 | Breaking below weekly low, Testing daily… |
| TLT | 20+ Year Treasury | Bond | $86.54 | -0.49% | 35.19 | BEARISH | 18.82 | 33.91 | 25.36 | 52.35 | 27.52 | Breaking below weekly low, Breaking belo… |
| FXY | Yen ETF | Currency | $57.54 | -0.16% | 30.40 | BEARISH | 20.29 | 32.09 | 26.86 | 38.91 | 26.85 | Breaking below weekly low, Breaking belo… |
| FXE | Euro ETF | Currency | $105.39 | -0.80% | 23.94 | BEARISH | 26.33 | 29.52 | 22.43 | 60.55 | 22.82 | Breaking below weekly low, Breaking belo… |
| LQD | Investment Grade Corp | Bond | $108.17 | -0.37% | 26.14 | BEARISH | 27.63 | 29.68 | 22.43 | 76.73 | 22.22 | Breaking below weekly low, Testing daily… |
| XLY | Consumer Discretionary | Sector | $110.86 | -0.59% | 29.53 | BEARISH | 31.54 | 26.39 | 27.33 | 61.30 | 21.92 | Breaking below weekly low, Breaking belo… |
| XLF | Financial Select | Sector | $48.89 | +0.12% | 29.42 | BEARISH | 36.36 | 33.44 | 23.25 | 78.85 | 20.18 | Testing daily high, RSI Oversold (29.4) |
Analisi Tecnica — Chart Collection


Instrument Analysis — Top & Bottom 5
Top Performers
USO
Oil Fund
Key Levels
Indicators
Signals
XLE
Energy Select
Key Levels
Indicators
Signals
^VIX
CBOE Volatility Index
Key Levels
Indicators
Signals
Key Levels
Indicators
Signals
XLU
Utilities Select
Key Levels
Indicators
Signals
Bottom Performers
FXY
Yen ETF
Key Levels
Indicators
Signals
FXE
Euro ETF
Key Levels
Indicators
Signals
LQD
Investment Grade Corp
Key Levels
Indicators
Signals
XLY
Consumer Discretionary
Key Levels
Indicators
Signals
XLF
Financial Select
Key Levels
Indicators
Signals
Options Insights & Strategy
Con VIX a 27.19 nel regime alto, la volatilità implicita è elevata,
rendendo le strategie di income (credit spreads, naked puts, call spreads) particolarmente attraenti.
Il premio opzionale è superiore alla media, favorendo venditori di volatilità.
Per acquirenti di volatilità, le opzioni risultano costose. Consigliato focus su credit spreads
e strategie con time decay favorevole in ambienti di elevata VIX.
Top 5 Instruments — Options Strategies
Bottom 5 Instruments — Options Strategies
Risk Management & Key Levels
Key Levels — Top 5 Instruments
| Ticker | Price | S2 | S1 | Pivot | R1 | R2 | ATR % |
|---|---|---|---|---|---|---|---|
| USO | $119.89 | $111.92 | $115.16 | $117.14 | $120.38 | $122.36 | 5.33% |
| XLE | $57.70 | $56.44 | $56.97 | $57.59 | $58.13 | $58.75 | 2.05% |
| ^VIX | $27.19 | $23.68 | $25.48 | $26.41 | $28.21 | $29.14 | 14.25% |
| UUP | $27.89 | $27.57 | $27.63 | $27.67 | $27.72 | $27.76 | 0.54% |
| XLU | $46.96 | $45.42 | $45.96 | $46.50 | $47.04 | $47.58 | 1.63% |
Sizing & Risk Recommendation
Per posizioni lunghe: utilizzare S2 come stop loss, con target a R1 o R2 a seconda del profilo risk/reward.
Per spread e strategie short: monitorare la convergenza verso supporti e resistenze chiave.
ATR% fornisce dimensionamento volatility-adjusted: posizioni più piccole su strumenti con ATR% elevato.
Con VIX elevato, ridurre esposizione gross delta e preferire posizioni delta-neutral o market-neutral.
What To Watch
- VIX trend: monitorare se scende sotto 20 (compression) o sale oltre 30 (panic)
- SPY e SMA200: rottura di {self.data[‘instruments’][‘SPY’][‘key_levels’][‘support_1’]} comporterebbe sell-off importante
- Divergenze RSI-prezzo: segnali di potenziale inversione su timeframe giornaliero
- Break di Bollinger Bands: spesso precedono movimenti direzionali forti
- Correlation regime: attenzione a spikes di correlazione (stress)
Sector Rotation Analysis
Sector ETF Performance
| Ticker | Sector | Price | Change % | MACD | Composite Score |
|---|---|---|---|---|---|
| XLK | Technology | $136.80 | -0.75% | BEARISH | 46.14 |
| XLF | Financials | $48.89 | +0.12% | BEARISH | 20.18 |
| XLE | Energy | $57.70 | +0.33% | NEUTRAL | 72.47 |
| XLV | Healthcare | $149.79 | -0.25% | BEARISH | 38.47 |
| XLI | Industrials | $164.65 | -0.36% | BEARISH | 42.57 |
| XLY | Consumer Discretionary | $110.86 | -0.59% | BEARISH | 21.92 |
| XLP | Consumer Staples | $84.74 | +0.58% | BEARISH | 41.28 |
| XLU | Utilities | $46.96 | +0.99% | NEUTRAL | 62.56 |
| XLRE | Real Estate | $42.25 | +0.26% | NEUTRAL | 44.91 |
Watchlist — Action Levels
USO
R/R Ratio: 0.31:1
XLE
R/R Ratio: 0.83:1
^VIX
R/R Ratio: 0.56:1
UUP
R/R Ratio: -0.41:1
XLU
R/R Ratio: 0.40:1
Infografica Riepilogativa:
Kriterion Quant Daily Market Analysis Report
Analysis Date: 2026-03-14 | Version: 1.0
All analysis is based on historical data and technical indicators. Markets are inherently unpredictable,
and past performance does not guarantee future results. Trading and options involve significant risk of loss.
Consult a qualified financial advisor before making investment decisions. Kriterion assumes no liability for
trading decisions based on this report.
Generated by Kriterion Quant DMA System | 2026-03-14 16:40:42