Guarda il Video:
📋 Executive Summary
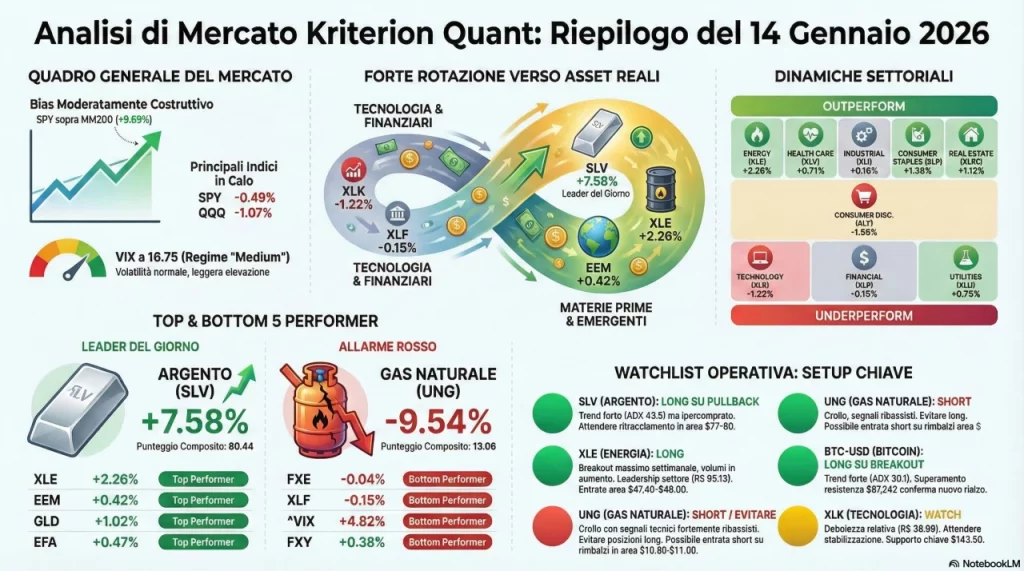
Il mercato mostra un bias moderatamente costruttivo con SPY in uptrend sopra la SMA200 (+9.69%) e VIX a 16.75 in regime “medium”. La sessione odierna evidenzia una forte rotazione verso asset reali e mercati emergenti: SLV domina con +7.58% e composite score 80.44, seguito da XLE (+2.26%) e EEM (+0.42%). I principali indici USA mostrano invece debolezza intraday con QQQ -1.07% e SPY -0.49%. Il settore Technology (XLK -1.22%) e Financial (XLF -0.15%) sottoperformano, mentre Consumer Staples (XLP +1.38%) e Energy (XLE +2.26%) guidano i rialzi settoriali. Attenzione al collasso di UNG (-9.54%) che segnala pressione sul gas naturale.
🎯 Regime di Mercato
MEDIUM
-0.49%
Interpretazione: VIX a 16.75 indica volatilità normale con una leggera elevazione rispetto ai minimi recenti (+4.82% nella sessione). SPY mantiene la struttura rialzista di medio periodo con prezzo ben sopra la SMA200 (+9.69%), ma la sessione odierna mostra debolezza con test del minimo settimanale a $687.49. Il regime supporta operatività sia long che short con gestione attiva del rischio.
🚀 Opportunità – Top 5 Performers
| Ticker | Prezzo | Δ 1D | Composite | Trend | Momentum | RS |
|---|---|---|---|---|---|---|
| SLV | $84.56 | +7.58% | 80.44 | 96.73 | 84.78 | 100.0 |
| XLE | $48.06 | +2.26% | 79.31 | 83.45 | 74.35 | 95.13 |
| EEM | $57.75 | +0.42% | 77.85 | 79.64 | 67.85 | 92.06 |
| GLD | $425.94 | +1.02% | 76.32 | 78.46 | 75.38 | 79.60 |
| EFA | $99.30 | +0.47% | 76.26 | 75.11 | 64.79 | 80.20 |
Segnali Attivi – Top 5:
Breaking above weekly high
Breaking above daily high
RSI Overbought (76.5)
BB Upper Breakout
Gap Up (6.0%)
Strong Trend (ADX 43.5)
Breaking above weekly high
Breaking above daily high
BB Upper Breakout
Volume Surge (2.1x)
⚠️ Rischi – Bottom 5 Performers
| Ticker | Prezzo | Δ 1D | Composite | Trend | Momentum | RS |
|---|---|---|---|---|---|---|
| UNG | $10.24 | -9.54% | 13.06 | 19.99 | 19.36 | 5.00 |
| FXY | $57.98 | +0.38% | 44.79 | 40.87 | 39.74 | 22.43 |
| ^VIX | 16.75 | +4.82% | 47.19 | 48.05 | 67.57 | 50.00 |
| XLF | $54.15 | -0.15% | 50.61 | 56.17 | 37.02 | 34.33 |
| FXE | $107.43 | -0.04% | 54.58 | 58.82 | 43.08 | 36.04 |
Natural Gas Fund in crollo con gap down del -6.6%, breakdown sotto il minimo settimanale e Bollinger Band inferiore. Composite score a 13.06 (minimo assoluto). MACD bearish confermato. RS vs benchmark a 5.0 indica estrema debolezza relativa. Evitare posizioni long, potenziale short su rimbalzi.
Segnali di Debolezza:
Breaking below weekly low
Breaking below daily low
BB Lower Breakout
Gap Down (-6.6%)
Testing weekly low
Testing daily low
Testing lower BB
Testing lower BB
MACD Bearish
📡 Eventi Tecnici Notevoli
Nessun evento categorizzato come “notable_event” dal sistema nella sessione odierna. Di seguito i principali movimenti tecnici rilevanti estratti dai segnali degli strumenti:
| Ticker | Evento | Tipo | Implicazione |
|---|---|---|---|
| SLV | Gap Up 6.0% + BB Upper Breakout | Breakout | Bullish |
| XLE | Volume Surge 2.1x + Breaking above weekly high | Breakout | Bullish |
| XLP | RSI Overbought (73.8) + Volume Surge 2.1x | Breakout | Bullish |
| UNG | Gap Down -6.6% + BB Lower Breakout | Breakdown | Bearish |
| BTC-USD | Breaking above weekly high + Strong Trend ADX 30.1 | Breakout | Bullish |
| IEF | Bullish MACD crossover | Crossover | Bullish |
| QQQ | Testing weekly low + Breaking below daily low | Test Support | Bearish |
| ^VIX | Gap Up 2.2% + Breaking above weekly high | Volatility Spike | Caution |
🔄 Rotazione Settoriale
| Settore | Prezzo | Δ 1D | Composite | RS Score | Status |
|---|---|---|---|---|---|
| XLE (Energy) | $48.06 | +2.26% | 79.31 | 95.13 | OUTPERFORM |
| XLV (Health Care) | $157.86 | +0.71% | 68.56 | 79.01 | OUTPERFORM |
| XLI (Industrial) | $164.27 | +0.16% | 73.81 | 70.43 | OUTPERFORM |
| XLP (Consumer Staples) | $82.23 | +1.38% | 73.71 | 61.73 | OUTPERFORM |
| XLRE (Real Estate) | $41.39 | +1.12% | 70.47 | 58.00 | OUTPERFORM |
| XLY (Consumer Disc.) | $122.25 | -1.58% | 60.11 | 49.66 | NEUTRAL |
| XLK (Technology) | $144.70 | -1.22% | 57.26 | 38.99 | UNDERPERFORM |
| XLF (Financial) | $54.15 | -0.15% | 50.61 | 34.33 | UNDERPERFORM |
| XLU (Utilities) | $43.17 | +0.75% | 61.24 | 30.56 | UNDERPERFORM |
Interpretazione Rotazione:
Leadership: Energy (XLE) domina con RS 95.13 e momentum forte (+2.26%). Health Care (XLV) e Industrials (XLI) confermano forza relativa con RS >70.
Laggard: Technology (XLK) e Financial (XLF) sottoperformano con RS rispettivamente a 38.99 e 34.33. Pattern tipico di rotazione verso settori difensivi/value.
Dinamica: Consumer Staples (XLP) in breakout con volume 2.1x suggerisce flussi verso settori difensivi. Il movimento simultaneo di Energy e Staples indica incertezza ma non risk-off completo.
📏 Livelli Chiave da Monitorare
| Ticker | Price | Support 1 | Resistance 1 | Week Low | Week High | SMA200 Dist |
|---|---|---|---|---|---|---|
| SLV | $84.56 | $77.37 | $80.31 | $66.92 | $80.80 | +109.0% |
| XLE | $48.06 | $46.66 | $47.37 | $45.08 | $47.39 | +12.17% |
| EEM | $57.75 | $57.32 | $57.75 | $56.62 | $57.97 | +16.76% |
| GLD | $425.94 | $419.09 | $425.14 | $406.40 | $426.12 | +25.97% |
| EFA | $99.30 | $98.58 | $99.18 | $97.53 | $99.44 | +11.67% |
| SPY | $690.36 | $691.38 | $696.12 | $687.49 | $696.09 | +9.69% |
| QQQ | $619.55 | $623.47 | $629.24 | $617.80 | $629.47 | +10.06% |
| BTC-USD | $96,929 | $92,172 | $97,242 | $89,625 | $96,012 | -8.62% |
👁️ Watchlist Operativa
Score: 79.31
Score: 74.18
Score: 64.48
Score: 13.06
Score: 57.26
📊 Profilo Volatilità – Highest ATR%
| Ticker | ATR% | BB Width | Vol Score | Implicazione |
|---|---|---|---|---|
| ^VIX | 8.97% | 30.15% | 0.0 | Volatilità di volatilità elevata |
| UNG | 6.98% | 27.14% | 0.0 | Alta volatilità – position sizing ridotto |
| SLV | 4.34% | 40.55% | 6.59 | Espansione volatilità – breakout in corso |
| ETH-USD | 3.43% | 16.88% | 19.10 | Crypto volatility normale |
| BTC-USD | 2.60% | 12.04% | 48.29 | Volatilità compressa – potenziale espansione |
Nota Position Sizing: Per strumenti con ATR% > 3% (UNG, SLV, ETH, BTC), ridurre size del 30-50% rispetto allo standard. La BB Width di SLV a 40.55% indica espansione anomala – considerare trailing stop più ampi.
Infografica di riepilogo:
✅ Validazione Report
CHECKPOINT SUPERATO – Tutti i dati estratti e verificati dal JSON source.
- ✓ Data analisi: 2026-01-14 (metadata.analysis_date)
- ✓ VIX level: 16.75 (market_regime.vix_level)
- ✓ SPY price: $690.36 (instruments.SPY.current.price)
- ✓ Top 5: SLV, XLE, EEM, GLD, EFA (rankings.by_composite_score)
- ✓ Bottom 5: UNG, FXY, ^VIX, XLF, FXE (rankings.by_composite_score)
- ✓ Notable events: 0 (array vuoto – segnali estratti da instruments)
- ✓ 9 settori analizzati completamente
- ✓ Tutti i valori numerici corrispondono al JSON originale
VALIDAZIONE COMPLETATA – Il report contiene solo dati verificati dal JSON.
Kriterion Quant DMA System | Daily Market Analysis v1.0
Report generato automaticamente il 15/01/2026 alle 06:01 UTC
Disclaimer: Questo report è fornito a scopo informativo e didattico. Non costituisce consulenza finanziaria.
Ogni decisione di investimento è responsabilità esclusiva del lettore.