La sessione del 24 febbraio 2026 presenta un mercato in modalità difensiva con il VIX a 21.01 (regime medium, in impennata del +10.06% nella giornata) e SPY in calo dell’1.02% a $682.39, pur mantenendo l’uptrend strutturale sopra la SMA200 (+5.11%). La rotazione settoriale è marcata: i capitali fuggono da Consumer Discretionary (XLY, composite 26.98, RS 0) e Financials (XLF, composite 21.04, RS 0) per concentrarsi su Energy (XLE, composite 74.37, RS 100), Utilities (XLU, composite 71.46) e metalli preziosi (GLD +2.70%, SLV +5.16%). Le crypto subiscono un selloff aggressivo con BTC a -4.50% e ETH a -5.23%, entrambi in forte trend ribassista (ADX >55). I bond governativi (TLT, IEF, LQD) chiudono tutti in positivo, confermando il flight-to-quality in atto.
🎯 BIAS GENERALE: CAUTAMENTE BULLISH con rotazione difensiva
Uptrend intatto su SPY ma VIX in espansione — privilegiare settori difensivi e commodity, ridurre esposizione growth/tech/crypto.
| Parametro | Valore | Status | Interpretazione |
|---|---|---|---|
| VIX Level | 21.01 | MEDIUM ⚠ | VIX nella fascia 20-28 indica cautela crescente. Gap up del +7.3% e spike intraday del +10.06% segnalano nervosismo improvviso. |
| VIX Regime | Medium | ELEVATED | ADX VIX a 31.9 conferma trend in forza sulla volatilità. |
| SPY Trend | Uptrend | BULLISH ✅ | Struttura di uptrend ancora intatta nonostante il ritracciamento odierno. |
| SPY > SMA200 | True (+5.11%) | SOPRA ✅ | SPY a $682.39, +5.11% dalla SMA200. Buffer sufficiente ma in erosione. |
| SPY Scores | 48.81 | NEUTRALE | Trend 55.04, Momentum 40.28, RS 50.0. MACD bearish, RSI a 45.36 in zona neutrale. |
| Market Condition | Neutral | NEUTRAL | Risk appetite neutrale. Uptrend intatto ma momentum in deterioramento. |
Energy Select Sector SPDR — Composite: 74.37
🚀 Momentum: 63.12
🔋 Volatility: 71.24
💪 RS: 100
RSI: 70.4
MACD: Bullish
ADX: 51.7
SMA200 Dist: +24.32%
Utilities Select Sector SPDR — Composite: 71.46
🚀 Momentum: 80.22
🔋 Volatility: 79.97
💪 RS: 83.86
RSI: 71.9
MACD: Bullish
ADX: 29.1
SMA200 Dist: +10.03%
Industrials Select Sector SPDR — Composite: 69.87
🚀 Momentum: 60.22
🔋 Volatility: 68.43
💪 RS: 99.50
RSI: 64.4
MACD: Bullish
ADX: 44.9
SMA200 Dist: +14.51%
🚀 Momentum: 59.13
🔋 Volatility: 74.69
💪 RS: 100
RSI: 63.4
MACD: Bullish
ADX: 35.6
SMA200 Dist: +18.93%
🚀 Momentum: 68.24
🔋 Volatility: 24.92
💪 RS: 65.68
RSI: 68.3
MACD: Bullish
ADX: 18.5
SMA200 Dist: +3.25%
Bitcoin — Composite: 18.93
🚀 Momentum: 43.56
🔋 Volatility: 82.71
💪 RS: 0
RSI: 31.7
MACD: Neutral
ADX: 57.7
SMA200 Dist: -34.51%
United States Natural Gas Fund — Composite: 19.87
Financial Select Sector SPDR — Composite: 21.04
🚀 Momentum: 28.45
🔋 Volatility: 73.42
💪 RS: 0
RSI: 34.0
MACD: Bearish
ADX: 27.7
SMA200 Dist: -3.49%
Ethereum — Composite: 23.03
🚀 Momentum: 39.74
🔋 Volatility: 62.65
💪 RS: 10.56
RSI: 30.4
MACD: Neutral
ADX: 55.8
SMA200 Dist: -46.66%
Consumer Discretionary Select Sector SPDR — Composite: 26.98
Il campo notable_events del JSON è vuoto per questa sessione. L’analisi dei segnali attivi per strumento evidenzia comunque numerosi eventi significativi:
| Tipo Evento | Strumenti Coinvolti | Bias |
|---|---|---|
| 🟢 Breaking Above Weekly High | GLD (+2.70%), SLV (+5.16%) | BULLISH |
| 🔴 Breaking Below Weekly Low | DIA, BTC-USD, ETH-USD, XLF | BEARISH |
| 🟡 RSI Overbought | XLE (70.4), XLU (71.9), IEF (70.9) | CAUTION |
| 🔴 BB Lower Breakout | XLF | BEARISH |
| 🟢 Gap Up | ^VIX (+7.3%), SLV (+2.3%) | MIXED |
| 🔵 Strong Trend (ADX >25) | BTC (57.7), ETH (55.8), XLE (51.7), XLI (44.9), EEM (35.6), ^VIX (31.9), XLU (29.1), GLD (28.5), XLF (27.7), USO (26.9) | DIRECTIONAL |
| Settore | Composite | RS Score | MACD | Change 1d% | Status |
|---|---|---|---|---|---|
| ⛽ XLE (Energy) | 74.37 | 100 | Bullish | +0.49% | LEADER |
| 💡 XLU (Utilities) | 71.46 | 83.86 | Bullish | +0.76% | LEADER |
| 🏭 XLI (Industrials) | 69.87 | 99.50 | Bullish | -1.35% | LEADER |
| 🏥 XLV (Health Care) | 67.09 | 77.46 | Bullish | +1.10% | OUTPERFORM |
| 🛒 XLP (Cons. Staples) | 60.79 | 64.69 | Bullish | +1.23% | OUTPERFORM |
| 🏠 XLRE (Real Estate) | 62.12 | 50.97 | Bullish | +0.11% | NEUTRAL |
| 💻 XLK (Technology) | 38.26 | 33.79 | Bearish | -1.68% | LAGGARD |
| 🛍 XLY (Cons. Discret.) | 26.98 | 0 | Bearish | -2.09% | LAGGARD |
| 🏦 XLF (Financials) | 21.04 | 0 | Bearish | -3.35% | LAGGARD |
| Ticker | Prezzo | Support 1 | PW Low | Resist 1 | PW High | Posizione |
|---|---|---|---|---|---|---|
| SPY | $682.39 | $684.09 | $675.78 | $692.42 | $690.06 | Sotto S1 ⚠ |
| XLE | $55.15 | $54.50 | $53.18 | $55.27 | $55.88 | Vicino R1 💪 |
| XLU | $46.68 | $45.98 | $45.20 | $46.59 | $47.08 | Sopra R1 🚀 |
| XLI | $174.83 | $175.82 | $172.64 | $178.43 | $178.22 | Sotto S1 ⚠ |
| EEM | $61.65 | $61.42 | $60.13 | $62.81 | $62.36 | Vicino S1 |
| LQD | $111.71 | $111.43 | $111.40 | $111.72 | $111.74 | A R1 💪 |
| GLD | $481.28 | $461.77 | $445.53 | $472.05 | $468.62 | Sopra R1 & PW High 🚀 |
| XLF | $50.73 | $51.97 | $51.25 | $52.75 | $52.78 | Sotto tutti i supporti 🔴 |
| Ticker | Motivazione | Entry | Stop Loss | Target 1 |
|---|---|---|---|---|
| XLE | Composite 74.37, RS 100, MACD bullish, ADX 51.7. Leader assoluto. Pullback su S1 per entry ottimale. | $54.50 | $53.18 | $55.88 |
| XLU | Momentum 80.22 (top panel), breaking above daily high in giornata risk-off. Flight-to-safety play. | $45.98 | $45.20 | $47.08 |
| GLD | RS 100, composite 66.95, breaking above weekly high (+2.70%). Safe-haven in espansione con ADX 28.5. | $472.05 | $445.53 | Breakout |
| XLI | RS 99.50, ADX 44.9, MACD bullish. Pullback odierno offre potenziale entry se recupera sopra S1. | $175.82 | $172.64 | $178.43 |
| Ticker | Motivazione | Livello Critico |
|---|---|---|
| XLF | Composite 21.04, RS 0, -3.35% oggi, BB Lower Breakout. Sotto tutti i supporti chiave. Short bias sotto $51.25. | $51.25 (PW Low) |
| XLY | Composite 26.98, RS 0, MACD bearish, sulla SMA200 (-0.01%). Rottura SMA200 apre scenario ribassista. | SMA200 / $114.43 (PW Low) |
| BTC-USD | Composite 18.93, trend 10.90, RS 0, ADX 57.7. Downtrend devastante, -34.51% da SMA200. No-touch zone. | $65,637 (PW Low) |
| Ticker | ATR % | Vol Score | BB Width | Implicazione |
|---|---|---|---|---|
| ^VIX | 12.01% | 53.31 | N/A | Volatilità della volatilità elevata. Gap up +7.3%. |
| SLV | 7.61% | 96.90 | 65.26 | Volatilità estrema, gap up +2.3%, breakout settimanale. |
| ETH-USD | 6.63% | 62.65 | 16.55 | Volatilità ribassista. Position sizing ridotto obbligatorio. |
| UNG | 6.51% | 86.50 | 42.68 | Altissima volatilità con trend debole. Rischio elevato. |
| BTC-USD | 4.78% | 82.71 | 13.18 | Volatilità in downtrend forte. Compressione BB possibile. |
Infografica Riepilogativa:
☑ Data analisi: 2026-02-24 (metadata.analysis_date)
☑ VIX Level: 21.01 (market_regime.vix_level)
☑ SPY Price: $682.39 (instruments.SPY.current.price)
☑ Top 5: XLE (74.37), XLU (71.46), XLI (69.87), EEM (68.44), LQD (68.40)
☑ Bottom 5: XLY (26.98), ETH-USD (23.03), XLF (21.04), UNG (19.87), BTC-USD (18.93)
☑ Notable events nel JSON: 0 (analisi segnali attivi da instruments utilizzata in alternativa)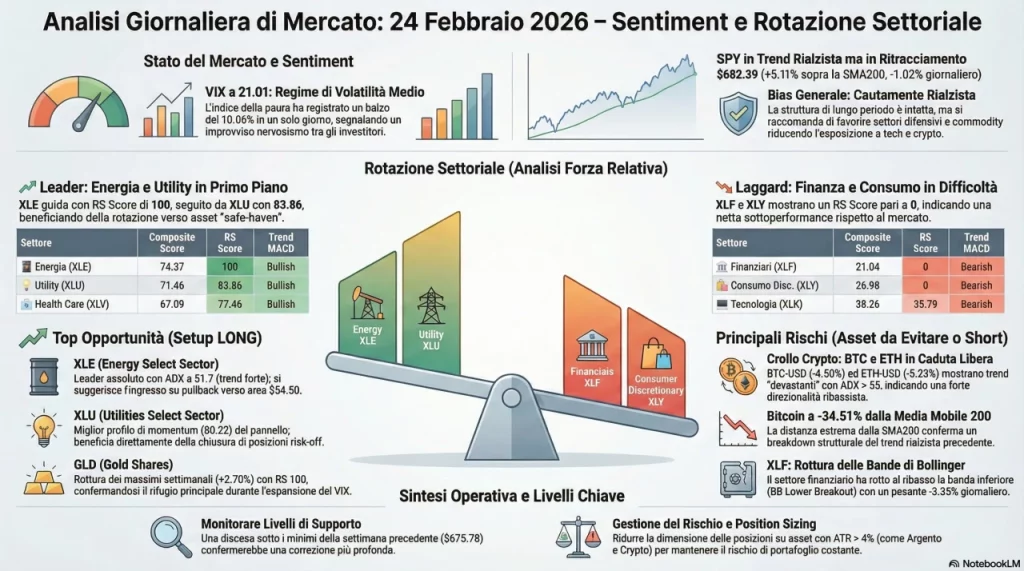
☑ Tutti i 9 settori coperti nella rotazione settoriale
☑ Tutti i valori numerici verificati contro il JSON sorgente
☑ Il report contiene solo dati verificati dal JSON.
Report generato dal Kriterion Quant DMA System v1.0 • 24 Febbraio 2026
Questo report è a scopo puramente informativo e didattico. Non costituisce consulenza finanziaria.
I dati sono estratti da fonti ritenute affidabili ma non se ne garantisce l’accuratezza.