DAILY MARKET ANALYSIS
Data Analisi: 19 Dicembre 2025 | Versione: 1.0
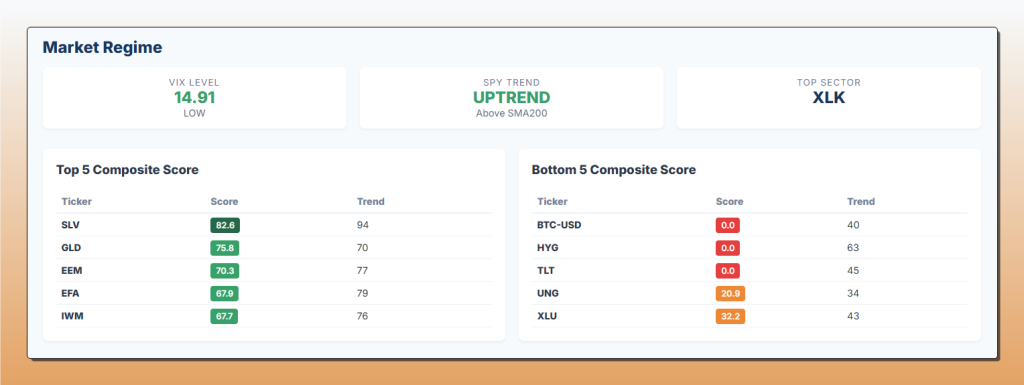
Dashboard Market Regime del 19 dicembre 2025. Il pannello superiore mostra: VIX a 14.91 (regime LOW), SPY in UPTREND sopra SMA200, Top Sector XLK (Technology). La classifica Top 5 Composite Score vede in testa SLV (82.6, trend 94), seguito da GLD (75.8, trend 70), EEM (70.3, trend 77), EFA (67.9, trend 79) e IWM (67.7, trend 76). Il Bottom 5 evidenzia debolezza su BTC-USD (0.0, trend 40), HYG (0.0, trend 63), TLT (0.0, trend 45), UNG (20.9, trend 34) e XLU (32.2, trend 43). Il contesto generale è Risk-On con metalli preziosi in leadership e difensivi/crypto in difficoltà.
Il mercato azionario statunitense si trova in una fase di RISK-ON caratterizzata da volatilità compressa. Il VIX a 14.91 (regime “low”) e SPY in uptrend sopra la SMA200 (+9.97%) confermano un contesto favorevole per posizioni long. I metalli preziosi dominano la classifica con SLV (composite 82.63) e GLD (75.84) ai vertici, supportati da forza relativa eccezionale. Attenzione ai settori difensivi in difficoltà: Utilities (XLU, composite 32.23) e Real Estate (XLRE, 35.95) mostrano debolezza strutturale. Il dollaro USA (UUP) rompe i massimi settimanali mentre lo Yen (FXY) subisce pressioni significative con volumi anomali.
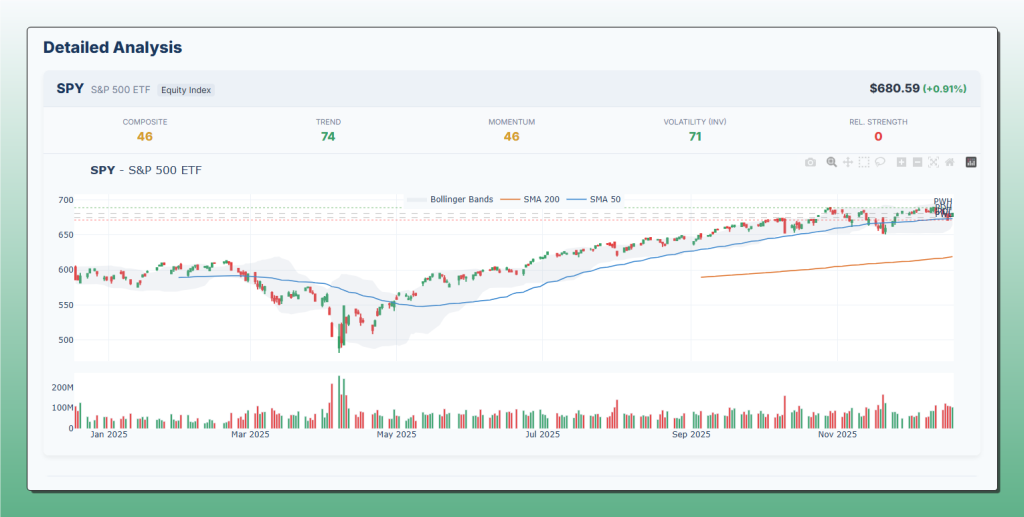
Analisi dettagliata SPY (S&P 500 ETF) al 19 dicembre 2025. Il grafico mostra il prezzo a $680.59 (+0.91%) con le Bollinger Bands, SMA 200 (arancione) e SMA 50 (blu). Gli score quantitativi indicano: Composite 46, Trend 74, Momentum 46, Volatility (inv) 71, Relative Strength 0. Il prezzo si mantiene ben sopra la SMA 200 in un chiaro uptrend iniziato da settembre 2025, con i massimi annuali raggiunti nelle ultime settimane. Il pannello dei volumi evidenzia attività nella norma senza spike anomali.
2. REGIME DI MERCATO
| Indicatore | Valore | Interpretazione |
|---|---|---|
| VIX Level | 14.91 | Regime LOW – Mercato compiacente |
| VIX Change 1D | -11.62% | Forte contrazione della volatilità implicita |
| SPY Trend | UPTREND | Trend rialzista confermato |
| SPY > SMA200 | SI (+9.97%) | Prezzo ben sopra la media mobile 200 |
| BIAS GENERALE | RISK-ON | Contesto favorevole per esposizione azionaria |
3. OPPORTUNITÀ – Top 5 Strumenti
| Ticker | Prezzo | Composite | Trend | Momentum | RS Score | Segnali |
|---|---|---|---|---|---|---|
| SLV | $60.93 | 82.63 | 94.32 | 89.37 | 100.00 | Breakout, RSI 74.8 |
| GLD | $399.02 | 75.84 | 69.92 | 69.49 | 97.89 | RSI overbought 71.1 |
| EEM | $53.72 | 70.30 | 76.64 | 47.96 | 75.39 | – |
| EFA | $95.46 | 67.93 | 79.24 | 63.52 | 56.90 | MACD bullish |
| IWM | $250.79 | 67.71 | 76.26 | 51.62 | 78.97 | – |
Analisi Top Performers
- SLV (Silver ETF): Leader assoluto con composite 82.63 e RS score perfetto (100). Breakout sopra il massimo settimanale ($60.64) con momentum eccezionale (89.37). MACD bullish. Distanza SMA200: +63.5%. ATR%: 2.93%. Warning: RSI in zona overbought a 74.8.
- GLD (Gold ETF): Secondo classificato con composite 75.84. Trend score solido (69.92) e RS score eccellente (97.89). MACD bullish confermato. Distanza SMA200: +21.88%. RSI a 71.1 segnala condizioni di ipercomprato.
- EEM (Emerging Markets): Composite 70.30 con trend score elevato (76.64). RS score 75.39 indica outperformance vs SPY. +0.98% nella sessione odierna.
4. RISCHI – Bottom 5 Strumenti
| Ticker | Prezzo | Composite | Trend | Momentum | Fattori di Rischio |
|---|---|---|---|---|---|
| XLU | $42.63 | 32.23 | 43.27 | 40.05 | RS 0.24, RSI 38.0, -1.27% oggi |
| UNG | $12.19 | 20.94 | 33.91 | 17.22 | -20.49% vs SMA200, volatilità 5.2% |
| TLT | $87.55 | N/A | 44.84 | 47.71 | MACD bearish, pressione tassi |
| HYG | $80.36 | N/A | 62.98 | 52.91 | Breaking weekly low |
| BTC-USD | $88,103 | N/A | 39.65 | 40.90 | -18.51% vs SMA200, MACD bearish |
5. EVENTI TECNICI NOTEVOLI
| Ticker | Tipo Evento | Implicazione |
|---|---|---|
| SLV | Breaking above weekly high | BULLISH – Breakout confermato, continuazione trend |
| SLV | RSI overbought (74.8) | WARNING – Possibile consolidamento a breve |
| GLD | RSI overbought (71.1) | WARNING – Monitorare per pullback |
| UUP | Breaking above weekly high | BULLISH – Forza del dollaro USA confermata |
| DIA | Bearish MACD crossover | BEARISH – Debolezza Dow Jones vs altri indici |
| XLP | Breaking below weekly low | BEARISH – Consumer Staples in difficoltà |
| XLRE | Breaking below weekly low | BEARISH – Real Estate continua trend negativo |
| HYG | Breaking below weekly low | BEARISH – Stress su high yield bonds |
| FXE | Breaking below weekly low | BEARISH – Debolezza Euro vs USD |
| FXY | Breaking below weekly low + Volume spike 2.2x + BB test | BEARISH – Yen sotto pressione significativa |
6. ROTAZIONE SETTORIALE
| Settore | Composite | RS Score | MACD | Status |
|---|---|---|---|---|
| XLK | 63.89 | 81.68 | Bearish | OUTPERFORM |
| XLY | 62.06 | 51.12 | Bullish | OUTPERFORM |
| XLV | 56.59 | 55.54 | Bearish | OUTPERFORM |
| XLF | 55.69 | 20.76 | Bullish | UNDERPERFORM |
| XLI | 55.55 | 25.64 | Bullish | UNDERPERFORM |
| XLP | 43.54 | 9.95 | Bullish | UNDERPERFORM |
| XLRE | 35.95 | 0.00 | Bearish | UNDERPERFORM |
| XLE | 35.63 | 2.63 | Bearish | UNDERPERFORM |
| XLU | 32.23 | 0.24 | Bearish | UNDERPERFORM |
Interpretazione Rotazione
Leadership Growth/Tech: XLK con RS score 81.68 guida il mercato, supportato da Consumer Discretionary (XLY). Pattern tipico di Risk-On con preferenza per settori ciclici.
Difensivi in difficoltà: Utilities (XLU), Real Estate (XLRE) e Consumer Staples (XLP) mostrano tutti RS score inferiori a 10, segnalando una chiara rotazione away from safety.
Energy debole: XLE con composite 35.63 e RS 2.63 è tra i settori peggiori nonostante il contesto risk-on. Possibile disconnessione dai fondamentali o pricing-in di scenari recessivi.
7. LIVELLI CHIAVE DA MONITORARE
| Ticker | Prezzo | Support 1 | Resist 1 | Week Low | Week High |
|---|---|---|---|---|---|
| SLV | $60.93 | $58.59 | $60.04 | $55.13 | $60.64 |
| GLD | $399.02 | $395.68 | $401.84 | $391.47 | $402.21 |
| EEM | $53.72 | $53.06 | $53.42 | $52.58 | $54.95 |
| EFA | $95.46 | $94.50 | $95.23 | $94.13 | $97.42 |
| IWM | $250.79 | $247.49 | $250.64 | $246.70 | $258.20 |
| SPY | $680.59 | $672.67 | $678.51 | $671.20 | $688.88 |
8. WATCHLIST OPERATIVA
SLV – Silver ETF [LONG]
- Motivazione: Composite score massimo (82.63), RS score perfetto (100), breakout confermato sopra $60.64. Trend score eccezionale (94.32) con MACD bullish.
- Entry: Pullback verso $60.04-60.64 (area ex-resistenza) o breakout continuation sopra $61.00
- Stop Loss: $58.50 (sotto support_1 e weekly low)
- Target: $65.00 (estensione trend), Risk/Reward ~2:1
GLD – Gold ETF [LONG con cautela]
- Motivazione: Secondo miglior composite (75.84), RS 97.89, MACD bullish. Correlato a SLV ma con volatilità inferiore.
- Entry: Attendere pullback RSI sotto 65, idealmente area $395-397
- Stop Loss: $391.00 (sotto weekly low)
- Target: $410.00, Risk/Reward ~2.5:1
QQQ – Nasdaq 100 ETF [LONG]
- Motivazione: Composite 65.62, RS score 82.49 (outperformance SPY). Tech leadership confermata da XLK (RS 81.68). +1.30% oggi.
- Entry: Attuale ($617.05) o pullback verso $612-615
- Stop Loss: $600.00 (sotto weekly low)
- Target: $630.00, Risk/Reward ~1.5:1
EFA – EAFE Markets ETF [LONG]
- Motivazione: Composite 67.93, trend score elevato (79.24), MACD bullish. Diversificazione geografica con outperformance.
- Entry: $95.46 (attuale) o pullback verso $94.50
- Stop Loss: $94.00 (sotto weekly low)
- Target: $98.00, Risk/Reward ~1.7:1
UUP – US Dollar Index [LONG su USD]
- Motivazione: Breaking above weekly high ($28.01). Forza USD confermata da debolezza EUR (FXE) e JPY (FXY). Composite 56.68.
- Entry: $28.07 (attuale) o breakout continuation
- Stop Loss: $27.80 (sotto weekly low)
- Target: $28.50, Risk/Reward ~1.6:1
XLU – Utilities [AVOID/SHORT]
- Motivazione: Composite minimo tra i settori (32.23), RS score 0.24, RSI 38.02 in discesa. -1.27% oggi contro mercato positivo. MACD bearish.
- Azione: Evitare posizioni long. Per short: entry sotto $42.54, stop $43.50, target $41.00
Scarica i Grafici Completi
DISCLAIMER
Questo report è prodotto esclusivamente a scopo informativo e educativo da Kriterion Quant. Non costituisce consulenza finanziaria, raccomandazione di investimento o sollecitazione all’acquisto/vendita di strumenti finanziari. I dati presentati derivano da analisi quantitative automatizzate e potrebbero contenere errori. Le performance passate non sono indicative di risultati futuri. Gli investitori dovrebbero condurre le proprie analisi e consultare professionisti qualificati prima di prendere decisioni di investimento. Kriterion Quant declina ogni responsabilità per perdite derivanti dall’utilizzo di queste informazioni.
VALIDAZIONE COMPLETATA – Il report contiene solo dati verificati dal JSON (dma_data_2025-12-20.json). Tutti i valori numerici sono stati estratti direttamente dalla fonte senza arrotondamenti arbitrari.